Abstract
Role of Iron in Collagen-expressing Proangiogenic Macrophages in Diabetic Nephropathy
Chhanda Bose PhD, Oleg Karaduta MD, Neriman Gokden MD, Anuhya Alapati MD, Gozel Jumayeva MD, Sneha Banerjee BS, Sudhir V. Shah MD, Swaminathan Sundararaman MD
Corresponding author: Chhandra Bose
Contact Information: Chhanda.Bose@ttuhsc.edu
DOI: 10.12746/swjm.v14i61.1703
ABSTRACT
Diabetic nephropathy is the leading cause of end-stage renal disease (ESRD) worldwide. The number of patients requiring hemodialysis for diabetes-related kidney disease has increased dramatically over the past two decades. Diabetes mellitus remains the leading cause of end-stage kidney disease (ESKD) in the United States, accounting for approximately 40% of patients requiring renal replacement therapy. Therefore, it is important to identify novel interventions to halt the progression of diabetic nephropathy.
Inflammatory mechanisms, including macrophage (MΦ) recruitment into the glomerulus and tubulointerstitial region, play an important role in diabetic nephropathy. In diabetic kidneys, macrophage development and accumulation depend on angiotensin II. Iron accumulation occurs in diabetic nephropathy. Iron dysregulation and heme oxygenase-1 (HO-1), an inducible regulator of heme and iron metabolism, have anti-inflammatory effect, so we need to assess their pro-fibrotic role and oxidative stress; they may promote macrophage profibrotic responses. These macrophages also play a central role in recycling iron from senescent erythrocytes. They can contain substantial intracellular and extracellular pools of catalytic iron, which promote free radical formation and oxidative stress.
We investigated the role of iron in collagen-secreting macrophages under hyperglycemic conditions. Human peripheral blood mononuclear cells (PBMCs) were cultured with normal (5 mM) or high (25 mM) glucose (GLUC) for 2–8 days in the presence of angiotensin II (Ang II). Ang II (0.1 or 1.0 µM) was added for 24 hours to 4 days. We assessed macrophage phenotype, procollagen-1 (PC-1), ferroportin (FPN), heme oxygenase-1 (HO-1), and angiogenic markers using immunofluorescence, Western blotting, and flow cytometry. Catalytic iron levels were measured, and the effect of iron chelation was evaluated using deferiprone (DFP; 25 µM). We examined human kidney tissue for CD163 and procollagen-1 expression. Our results showed that high glucose increased the number of CD163+ and CD68+ macrophages expressing procollagen-1. Ang II further enhanced these responses. Hyperglycemia and Ang II increased catalytic iron levels (P < 0.0001) and altered HO-1 and FPN expression, consistent with activation of iron- and oxidative stress-related pathways. Collagen-expressing macrophages displayed an angiogenic phenotype, with increased lectin and acetylated low-density lipoprotein (LDL) expression. Deferiprone significantly reduced macrophage adhesion, PC-1 expression, and angiogenic markers. In human kidney tissue, CD163+ macrophages and procollagen-1+ cells were detected in the interstitium and sclerotic glomeruli, with procollagen-1+ cells predominantly localized to the interstitium.
Hyperglycemia and Ang II promote iron accumulation and the development of collagen-secreting, fibrotic, and proangiogenic macrophages. These cells may play an important pathophysiological role in the progression of diabetic nephropathy. The association with FPN and HO-1 suggests that iron recycling pathways may be involved in this response. Iron chelation attenuated these macrophage phenotypes, supporting the iron–FPN–HO-1 axis as a potential therapeutic target in diabetic nephropathy.
Our findings identify catalytic iron accumulation as a potential driver of a collagen-secreting, proangiogenic macrophage phenotype induced by the combined dysmetabolic and renin–angiotensin stress associated with diabetes.
Keywords: Angiogenic markers, Angiotensin II, Catalytic iron, diabetic nephropathy, Deferiprone, iron chelation, Glucose, pro-collagen and profibrotic positive macrophages, peripheral blood mononuclear cells
INTRODUCTION
Diabetes mellitus (DM) remains a major global health challenge, contributing substantially to morbidity, mortality, and healthcare expenditures.1 Among its most serious complications, diabetic nephropathy (DN) is a leading cause of chronic kidney disease and end-stage renal disease (ESRD) worldwide.2 Progressive deterioration of renal function is also closely associated with an increased risk of cardiovascular morbidity and mortality.3 Although the pathogenesis of DN is complex and multifactorial, accumulating evidence indicates that chronic inflammation, characterized by persistent recruitment and activation of immune cells, is a critical driver of renal injury and fibrosis.4
Macrophages are among the predominant immune cells involved in diabetic renal inflammation and accumulate extensively within the glomeruli and tubulointerstitium of diabetic kidneys.4 Chemokine–chemokine receptor signaling largely mediates their recruitment. Following infiltration, activated macrophages promote and sustain renal inflammation by releasing proinflammatory mediators, including monocyte chemoattractant protein-1 (MCP-1), tumor necrosis factor-α (TNF-α), and interleukin-1 (IL-1). These inflammatory signals further promote immune-cell recruitment, exacerbate glomerular and tubular injury, stimulate extracellular matrix deposition, and contribute to renal fibrosis progression.5 Thus, macrophage-driven inflammation represents an important mechanism linking metabolic stress to structural and functional renal damage in diabetic nephropathy (DN).
In addition to inflammation, dysregulated angiogenesis and disrupted podocyte–glomerular endothelial cell (GEC) crosstalk have important roles in Diabetic Nephropathy (DN) development and progression.6,7
The diabetic kidney is characterized by abnormalities in angiogenic signaling, particularly involving the vascular endothelial growth factor A (VEGF-A)/VEGF receptor 2 (VEGFR2) and angiopoietin pathways, which contribute to glomerular endothelial dysfunction and altered vascular permeability.6,7 Persistent hyperglycemia and oxidative stress can disrupt the balance in these pathways, leading to excessive VEGF-A signaling, abnormal endothelial responses, and increased vascular permeability. Conversely, endothelial injury can further compromise podocyte integrity and function, thereby amplifying glomerular barrier dysfunction.7,8 These findings suggest that impaired angiogenic signaling and disrupted podocyte–glomerular endothelial cell (GEC) communication contribute to diabetic glomerular injury.
A critical but comparatively underexplored component of this pathogenic network is dysregulated iron metabolism. Emerging evidence indicates that urinary catalytic iron, or labile iron capable of participating in redox reactions, is significantly increased in patients with diabetes and in experimental models of diabetic kidney disease.9 Labile iron can catalyze the generation of highly reactive hydroxyl radicals through iron-dependent redox reactions, including the Haber–Weiss/Fenton chemistry, thereby increasing oxidative stress and promoting cellular injury.9,10 Excessive iron-mediated reactive oxygen species (ROS) generation may contribute to endothelial dysfunction, inflammatory activation, and tissue damage, potentially linking metabolic abnormalities, renal inflammation, and vascular dysfunction.
Despite growing evidence implicating inflammation, angiogenic dysregulation, and oxidative stress in diabetic nephropathy (DN), the potential interplay among macrophage activation, aberrant angiogenesis, and iron-dependent oxidative injury remains insufficiently understood. Whether catalytic iron contributes to macrophage-driven renal inflammation and endothelial dysfunction, and how these processes affect podocyte–glomerular endothelial cell (GEC) crosstalk, warrants further investigation. Iron dysregulation may connect diabetes and oxidative tissue injury. A prior review from our group highlighted the potential role of catalytic or redox-active iron in diabetes and its complications, including diabetic nephropathy, by promoting free-radical formation and oxidative injury.11 Because macrophages are major regulators of systemic iron recycling and can accumulate substantial amounts of intracellular iron, they may be particularly susceptible to iron-mediated oxidative stress. However, whether catalytic iron accumulation contributes to a profibrotic and angiogenic macrophage phenotype under diabetic conditions remains unclear.
Macrophages, particularly the CD163+ subpopulation, are key regulators of systemic and local iron homeostasis. Under physiological conditions, CD163+ macrophages scavenge hemoglobin-haptoglobin complexes and process heme via heme oxygenase to recycle iron.12 However, dysregulation of this pathway, involving the iron-export protein ferroportin (FPN) and its negative regulator hepcidin, can cause abnormal iron accumulation and contribute to a pro-inflammatory, tissue-damaging phenotype. Pathogenic mutations in FPN (SLC40A1) that impair iron export cause cellular iron retention and iron-overload disorders, while dysregulated iron homeostasis has been associated with increased risk of diabetes and progressive renal injury.13–15 Given these mechanisms, therapeutic targeting of macrophage-mediated iron dysregulation and angiogenic abnormalities represents a promising yet underutilized strategy to arrest the progression of diabetic nephropathy. As renal function deteriorates, the risk of cardiovascular morbidity escalates, underscoring the urgent need for research into novel interventions, such as targeted iron chelation, to mitigate this decline and improve clinical outcomes.15 Hyperglycemia and Ang II increase macrophage catalytic iron, promoting a profibrotic and angiogenic macrophage phenotype that may contribute to the progression of diabetic nephropathy. In the present study, we investigated whether hyperglycemia and angiotensin II promote catalytic iron accumulation and functional activation of human macrophages toward a collagen-positive and proangiogenic phenotype. Using human peripheral blood mononuclear cells, we examined macrophage markers, procollagen-1, ferroportin, catalytic iron, and angiogenic markers under normal- and high-glucose conditions, with or without Ang II. We also tested whether deferiprone-mediated iron chelation could attenuate these responses and examined human diabetic kidney tissue for CD163-positive macrophages and procollagen-1-positive cells.
METHOD
PERIPHERAL BLOOD MONONUCLEAR CELLS (PBMCs)
Commercially available human peripheral blood mononuclear cells (PBMCs) were obtained from ALLCELLS (Emeryville, CA). Cell viability was assessed using the trypan blue dye exclusion test. PBMCs were cultured in Dulbecco’s modified Eagle’s medium (DMEM) supplemented with 10% fetal bovine serum (FBS), 2 mM L-glutamine, 100 U/mL penicillin, and 100 µg/mL streptomycin and maintained at 37°C in a humidified atmosphere containing 5% CO2. After overnight incubation in complete growth medium, PBMCs were treated with 5 mM (control medium) or 25 mM (high-glucose medium) glucose to investigate the effects of glucose (GLUC) and angiotensin II (Ang II) on monocyte differentiation into collagen-secreting, angiogenic macrophages. To assess hypertonicity, corresponding concentrations of D-mannitol were used instead of D-glucose in some experiments.16 Angiotensin II (0.1 or 1 µM) was added to the culture for 24 hours to 4 days. Cells were cultured for a total of 8 days with or without GLUC and Ang II. To assess the effect of deferiprone (DFP), PBMCs were pretreated with 25 µM deferiprone for 24 hours before glucose and angiotensin II were added to the culture. At the end of the experiments, cell culture supernatants were collected to measure bleomycin-detectable iron. Adherent cells were washed with 1× PBS and used to analyze proangiogenic markers (acetylated LDL and lectin), the fibrotic marker procollagen-1, and the iron metabolism regulator ferroportin. CD163+ and CD68+ macrophages were examined by immunofluorescence staining, flow cytometry, and Western blot analysis.
CELL PROLIFERATION ASSAYS
For the proliferation assay, total PBMCs were seeded in 96-well flat-bottom microplates (BD Falcon) at 20 × 103 cells/well and treated with GLUC, Ang II, and DFP (25 µM) in DMEM containing 10% FBS, as described above. After treatment, floating cells were removed from the culture. Adherent cells were washed with 1× PBS and used to assess bromodeoxyuridine (BrdU) incorporation. BrdU incorporation was determined during the last 4 hours of incubation in the presence of 10 M BrdU and measured colorimetrically using a BrdU ELISA kit (Roche Diagnostics, Indianapolis, IN), according to the manufacturer’s instructions, to identify cells in the S phase of the cell cycle. Absorbance was measured at dual wavelengths of 450 and 540 nm using a microplate reader. Proliferation was expressed as the percentage of absorbance in treated cells relative to untreated control cells.
IMMUNOFLUORESCENCE STUDY
Total PBMCs were seeded in 4-well BD chamber slides (Fisher Scientific) at a density of 150 × 103 cells/chamber in complete growth medium and treated with GLUC, Ang II, and DFP as described above. Immunofluorescence was performed to assess the expression of CD68, F4/80, procollagen-1, CD163 (all from Santa Cruz Biotechnology, Inc.), Ulex lectin (Sigma), acetylated LDL (Molecular Probes), and ferroportin (Abcam). After treatment, adherent cells were washed with 1× PBS and fixed with 4% neutral buffered formaldehyde for 15 minutes at room temperature. Slides were washed with 1× PBS three times for 5 minutes each and then rinsed with 100% alcohol. To block nonspecific binding sites, cells were incubated with 0.1% Triton X-100 and 5% goat serum for 30 minutes at room temperature, followed by three washes with 1× PBS for 5 minutes each. Cells were incubated with primary antibodies (2–10 µg/mL; described above), diluted in 1% BSA and 1× PBS, at 37°C for 1 hour. Cells were washed three times with 1× PBS for 5 minutes each. Either FITC (fluorescein isothiocyanate)- or TR (Texas Red)-conjugated secondary antibodies (Santa Cruz Biotechnology, Inc.) and/or Alexa Fluor 488- and 546-conjugated anti-goat/rabbit and mouse IgG antibodies (Molecular Probes) were used. Secondary antibodies (2–10 µg/mL), diluted in 5% goat serum in 1× PBS, were added to the cells and incubated at 37°C for 1 hour. For double labeling, cells were incubated with a cocktail of different primary antibodies, followed by the corresponding secondary antibodies. For negative controls, cells were incubated with IgG alone without specific primary antibodies. Cells were washed five times with 1× PBS for 5 minutes each and mounted with Vectashield mounting medium (Vector Laboratories) containing DAPI to counterstain the nuclei. Slides were observed under a fluorescence microscope (Olympus America, Melville, NY).
FLOW CYTOMETRIC ANALYSIS
After treatment and culture of PBMCs with GLUC, with or without Ang II and DFP, for the required period as described above, cells were analyzed by flow cytometry for procollagen-positive macrophages. Briefly, cells were harvested either by incubation with trypsin-EDTA solution for 5 minutes or by gentle scraping with a cell scraper after a 30-minute incubation on ice, followed by washing with 1× cold PBS.
After blocking Fc receptors with 1 µg/mL human IgG (Sigma, St. Louis, MO) for 15 minutes, samples were centrifuged at 200 × g for 5 minutes at 4°C. Cells were washed with 1× cold PBS. Cell samples (0.5 × 10⁶–1 × 10⁶ cells) were incubated on ice with sample blocking buffer (10% mouse/goat serum and 1% BSA) to block nonspecific binding sites. After 30 minutes of incubation, samples were centrifuged at 200 × g for 5 minutes at 4°C.
Cells were stained with unconjugated or phycoerythrin (PE)- or fluorescein isothiocyanate (FITC)-conjugated mouse, goat, rabbit, or rat antibodies against CD68 (Miltenyi Biotec, CA, USA), F4/80 (Novus Biologicals, CO, USA), CD163 (eBioscience, Inc., San Diego, CA), and procollagen-1 (Santa Cruz Biotechnology, Inc.). Antibodies (0.25 µg) were added in a total volume of 100 µL of cell staining buffer (eBioscience), and cells were incubated for 45 minutes on ice in the dark. Cell samples were washed three times with 100 µL of staining buffer and centrifuged at 200 × g for 5 minutes at 4°C. For unconjugated procollagen-1 antibodies, cells were subsequently incubated with FITC/PE-conjugated goat anti-mouse IgG (Santa Cruz Biotechnology) for 45 minutes on ice in the dark. For intracellular staining, cells were fixed in cold 4% paraformaldehyde and permeabilized using cell permeabilization buffer (eBioscience). For controls, cells were incubated with the same amount of PE- or FITC-labeled IgG isotype control (eBioscience, Novus, Miltenyi, or Santa Cruz Biotechnology). Each sample was resuspended in 0.2 mL of staining buffer and analyzed using a FACSDiva flow cytometer (Becton, Dickinson). At least 10,000 cells were analyzed per staining. Data were analyzed using CellQuest software (Becton, Dickinson). Viable cells were identified by gating on forward and side scatter. Data were presented as dot plots and expressed as mean fluorescence intensity (MFI), obtained from statistical analysis of fluorescence height and the mean x-axis value displayed by the software.
BLEOMYCIN-DETECTABLE IRON ASSAY
At the end of incubation, the culture medium was collected, and the catalytic iron (capable of catalyzing free-radical reactions) released into the medium was measured by the bleomycin assay developed and described by.17 One milliliter of the reaction mixture contained, in order: 0.5 ml of calf thymus DNA (1 mg/ml), 0.05 or 0.1 ml of bleomycin sulfate (1 mg/ml), 0.1 ml of MgCl2 (50 mM), 0.1 ml of sample, 0.1 ml of Chelax-treated pyrogen-free water, 0.1 ml of ascorbic acid (8 mM), and either 0.05 ml of HCl (10 mM) or 0.1 ml of imidazole (1.0 M, pH 7.3) to adjust to pH 7.4. Sample blanks were identical except that bleomycin was omitted. The samples were then incubated at 37°C for two hours with shaking. The reaction was stopped by adding 0.1 M EDTA; then the mixture was combined with 1 mL thiobarbituric acid (1% wt/vol in 50 mM NaOH) and 1 mL 25% HCl (vol/vol). The reaction mixture was heated at 100°C for 15 minutes, cooled, and the resulting chromogen was measured at 532 nm using a spectrophotometer. A standard curve was prepared using known amounts of FeCl3 in Chelax-treated pyrogen-free water. The amount of bleomycin-detectable iron in the test sample was calculated from the standard curve, and the results are expressed as nmol/mg cellular protein recovered from the cell monolayer. Protein was measured using the Bio-Rad reagent. All reagents, except the sample under test, were prepared in Chelex-treated, pyrogen-free water and shaken with Chelex-100 to remove as much contaminating iron as possible.
WESTERN BLOT ANALYSIS
SDS-PAGE was performed on a 4–12% bis-Tris NuPage separating gel (Invitrogen Life Technologies; Carlsbad, CA). Equal amounts (40 µg) of protein were loaded into each lane, and the separated proteins were electroblotted onto nitrocellulose membranes at 30 V for 1 h at room temperature. Membranes were blocked with casein blocker (Pierce; Rockford, IL) for 1 h at room temperature and then probed with primary antibodies (CD68, CD163, procollagen-1 (Santacruz Biotechnology, Inc.), and F4/80 [Novus Biologicals]) diluted 1:1,000 in 5% non-fat dry milk and incubated overnight at 40C with gentle shaking. Membranes were washed five times (5 min each) with Tris-buffered saline-Tween 20 [TBST; 20 mM Tris·HCl (pH 7.6), 137 mM NaCl, and 0.2% (vol/vol) Tween 20], followed by incubation with horseradish peroxidase-coupled anti-IgG secondary antibodies (1:2,000 dilution) for 1 h at room temperature. Enhanced Chemiluminescence (SuperSignal West Pico Chemiluminescent Substrate, Thermo Scientific, IL, USA) and fluorescence detection steps were performed per the manufacturer’s instructions to visualize the bands. For the loading control, nitrocellulose membranes were stripped with Restore Western Blot Stripping Buffer (Thermo Scientific) and reprobed with anti-actin antibody (1:1000 dilution, Santa Cruz Biotechnology).
IMMUNOHISTOCHEMISTRY
The Institutional Review Board of the University of Arkansas for Medical Sciences (UAMS) approved this study. Staining was performed on paraffin blocks from human diabetic kidney biopsies for CD163 (Santa Cruz Biotechnology, Inc.) and procollagen-1 (Abcam) using commercially available kits according to the manufacturers’ instructions.
STATISTICAL ANALYSIS
Results are reported as mean ± standard deviation (SD). The significance of differences among groups for all parameters was evaluated using one-way analysis of variance (ANOVA), followed by Tukey’s post hoc test, or by an unpaired two-tailed Student’s t test, using GraphPad Prism version 10. Differences were considered significant at p < 0.05.
RESULTS
EFFECT OF DFP ON DNA SYNTHESIS IN DIFFERENTIATED PBMCS UNDER HYPERGLYCEMIC CONDITIONS
Using the colorimetric BrdU ELISA kit, we found that 25 µM glucose increased BrdU incorporation into DNA over 8 days compared with the control and further increased after adding 1 µM Ang II to ~3.4-fold above control (p < 0.0001). We then investigated the effects of iron chelation with 25 µM DFP pretreatment for 24 h on the proliferative pattern of cells after glucose and Ang II post-treatments. DFP pretreatment significantly reduced DNA synthesis (p < 0.0001) compared with cultures without it (~1.6-fold; Figure 1A and B).
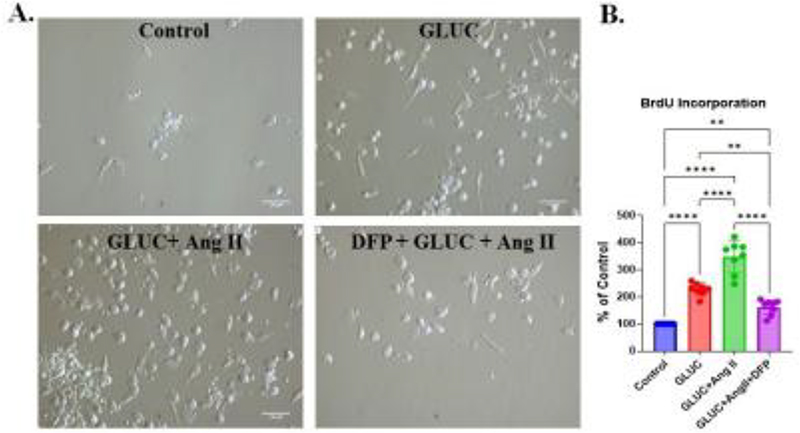
Figure 1. DFP pretreatment inhibited the growth and differentiation of human PBMCs, as assessed by cell proliferation and differentiation in PBMCs treated with 25 µM GLUC and 1 µM Ang II for 8 days. Ang II was added on day 5 after GLUC treatment, without removing GLUC. To assess the effect of iron chelation, cells were pretreated with 25 µM DFP for 24 h before GLUC and Ang II treatments. DFP-pretreated cultures showed fewer adherent cells. Panel A shows representative light-microscopic images from each group, with the combination group showing the highest cell count. Images were taken at 20X with a 100 µm scale bar. B. Relative values for DNA synthesis by viable cells, measured by BrdU incorporation assay on day 8. Histograms show BrdU incorporation into DNA to identify cells in the S phase of the cell cycle. The asterisk indicates a significant difference from untreated (control) cells (**P < 0.01, ****P < 0.0001; one-way ANOVA followed by Tukey-Kramer test; N = 4).
Differentiation of human PBMCs into cells expressing the angiogenic and fibrotic markers after treatment with GLUC and Ang II. We assessed the phenotypes of differentiated cells. Immunofluorescence staining showed that the number of AcLDL- and lectin-positive cells increased after GLUC and Ang II treatment. Proangiogenic cells co-express the macrophage marker (CD163) (Figure 2B). DFP pretreatment significantly reduced the number of cells expressing acetylated LDL (AcLDL) and Ulex lectin or PC-1 (Figure 2A and B). Flow cytometry analysis showed the same results (Figure 2C). Differentiated PBMCs expressing Ulex lectin were positive for macrophage markers. were positive for the macrophage marker tested.
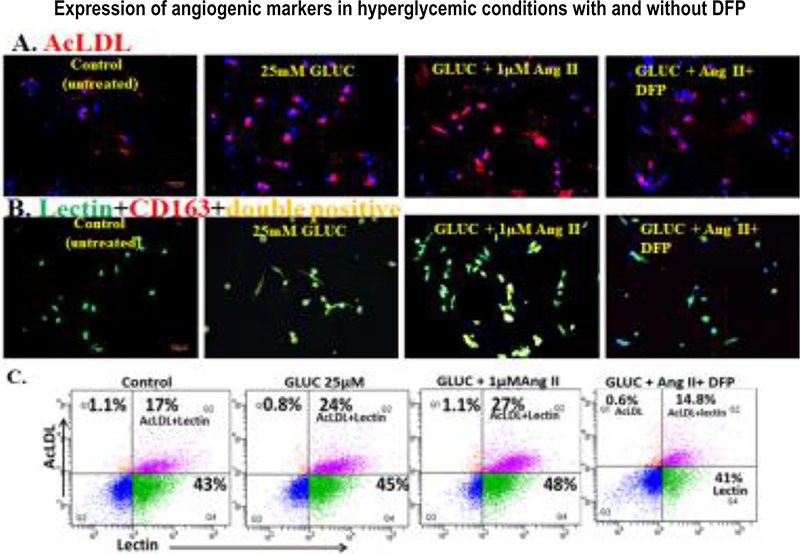
Figure 2. Expression of angiogenic markers (AcLDL) (A) and (Ulex lectin) (B) by differentiated human PBMCs treated with 25 µM GLUC or GLUC and 1 µM Ang II in combination, as shown by immunofluorescence and flow cytometry. Panel B shows that angiogenic (Lectin) cells are double-positive for CD163 (yellow). Scale bars: 10 µm for all. Representative images are from four different experiments; images were taken at 10×. Panel C depicts dot-plot images of flow cytometry analysis for the expression of proangiogenic and macrophage markers. Viable cells were identified by gating on forward and side scatter, and expression was reported as mean fluorescence intensity, obtained from statistical analysis of the fluorescence height and the mean x-axis value displayed by the software. As shown, DFP pretreatment significantly decreases the number of angiogenic cells. Representative dot plots are from three different experiments.
Next, we tested whether differentiated PBMCs are macrophages co-expressing procollagen-1. As shown in Figure 3A and Figure 4A, in the presence of GLUC or GLUC with Ang II, there was a higher number of macrophages co-expressing PC-1. We further examined these macrophages by flow cytometry for PC-1 co-expression; analysis confirmed these findings (Figure 3B and Figure 4B). We obtained similar results in Western blot analysis of macrophage-related proteins, further confirming our immunofluorescence and flow cytometry results (Figure 5).
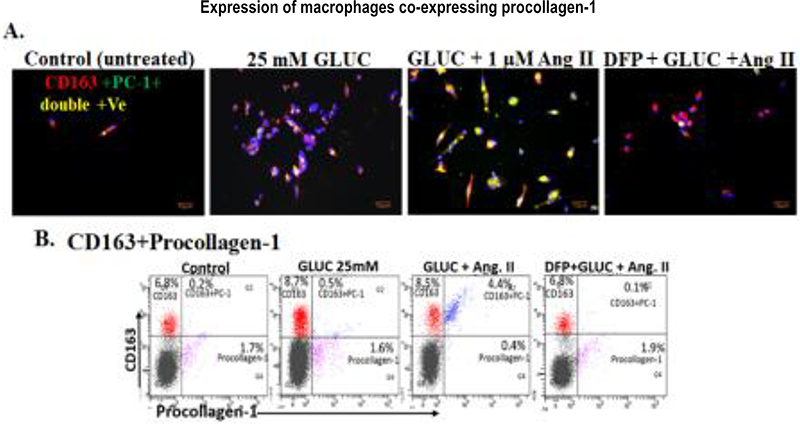
Figure 3. Macrophages co-expressing procollagen-1 in human PBMCs in a hyperglycemic condition in vitro. Panels A and B show CD163 macrophages co-expressing PC-1, as observed by immunofluorescence staining (A) and flow cytometry (B). For flow cytometry, at least 10000 cells per sample were analyzed on a FACSDiva flow cytometer (Becton Dickinson). Viable cells were identified by gating on forward and side scatter, and data are shown as dot plots and expressed as mean fluorescence intensity, obtained from statistical analysis of the fluorescence height and mean x-axis value displayed by the software. Data were analyzed using CellQuest software (Becton Dickinson) (n = 4). As shown, DFP pretreatment significantly decreases the number of macrophages expressing PC-1. cells. Representative dot plots are from three different experiments.
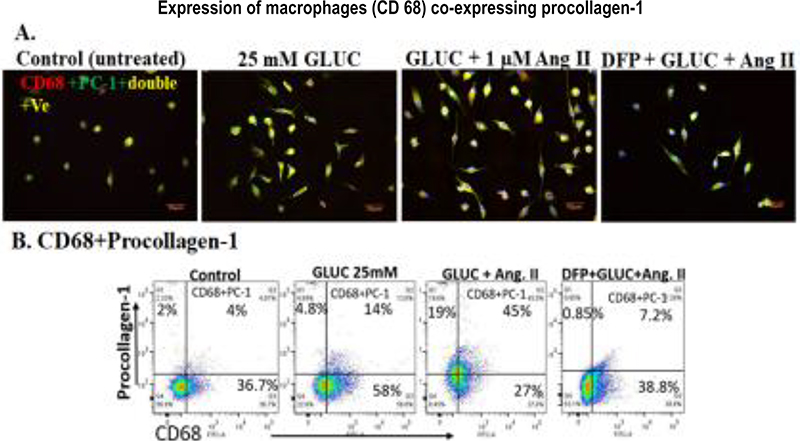
Figure 4. Macrophages co-expressing procollagen-1 in human PBMCs under hyperglycemic conditions in vitro. Representative immunofluorescence images of CD68-positive macrophages expressing PC-1 (Panel A). Flow cytometry dot plots (B) show PC-1 reactivity in macrophages. For flow cytometry, we analyzed samples on a FACSDiva flow cytometer (Becton Dickinson). We analyzed at least 10000 cells per staining. We analyzed data using CellQuest software (Becton Dickinson). Viable cells were identified by gating on forward and side scatter, and data are shown as dot plots and expressed as mean fluorescence intensity, obtained from statistical analysis of the fluorescence height and mean x-axis value displayed by the software.
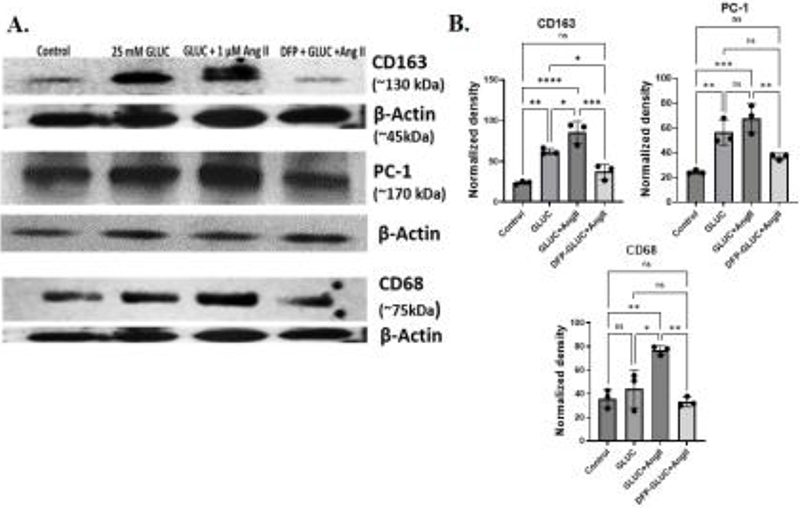
Figure 5. Induction of CD163+ and procollagen-1 protein as shown by Western blot analysis in human PBMCs treated with 25 mM glucose and 1 µM angiotensin II and pretreated with 25 µM of DFP for 24 h. Representative blots (n = 3) are shown; β-actin was used as a loading control. B. Quantitative analysis of densitometry bands was performed by One-Way ANOVA with Tukey’s multiple comparisons test (*P = 0.029, **P = 0.002, ***P = 0.0005, ****P < 0.0001).
Role of Catalytic Iron in the differentiation of human PBMCs into MΦ phenotype: Iron chelation reduced the number of differentiated human PBMCs expressing angiogenic and fibrotic markers under hyperglycemic conditions. We further assessed the effect of DFP on differentiated cells with an MΦ phenotype expressing PC-1. Our results show that 24 h DFP pretreatment significantly reduced the number of double-positive cells expressing acetylated LDL (AcLDL) and Ulex lectin (Figure 2A, B and C), as shown by immunofluorescence staining. Flow cytometry analysis confirmed these findings. Results showed that after 24 h of iron chelation, there was a significant % reduction in cells co-expressing AcLDL, lectin, CD163, CD68, and procollagen-1 under hyperglycemic conditions (last panels of Figure 3A-C and Figure 4A-C). Hyperglycemia-induced protein expression of CD163, CD68, and procollagen-1 was significantly attenuated after 25 µM DFP pretreatment, as shown by Western blots (Figure 5), further confirming our immunofluorescence and flow cytometry results.
Presence of CD163 and Procollagen-1 in kidney biopsies of patients with advanced diabetic nephropathy. Immunohistochemical analysis identified CD163+ macrophages in both the renal interstitium and sclerotic glomeruli (Figures 6 and 7), consistent with macrophage accumulation in areas of chronic renal injury and fibrosis. Procollagen-1+ cells were also detected in the interstitium and sclerotic glomeruli but were more prominent in the interstitium (Figure 7). The co-localization of CD163+ macrophages with areas of procollagen-1 expression supports a potential association between macrophage accumulation in glomeruli and matrix production in fibrotic kidney lesions.
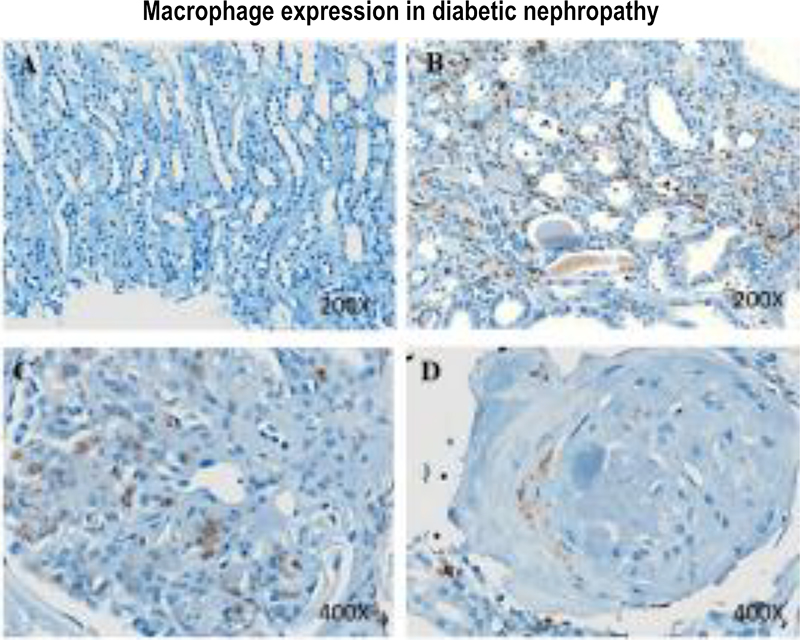
Figure 6. Macrophage expression in diabetic nephropathy. Immunohistochemical staining of kidney biopsies for CD163. Significantly more CD163+ (brown) cells are evident in the renal interstitium of patients with diabetic nephropathy (B) than in a healthy kidney (A). CD163+ (brown) cells are significantly more abundant in the glomerulus of a patient with diabetic nephropathy (C). Periglomerular CD163+ macrophages (brown) are present in a sclerotic glomerulus in advanced diabetic nephropathy (D).
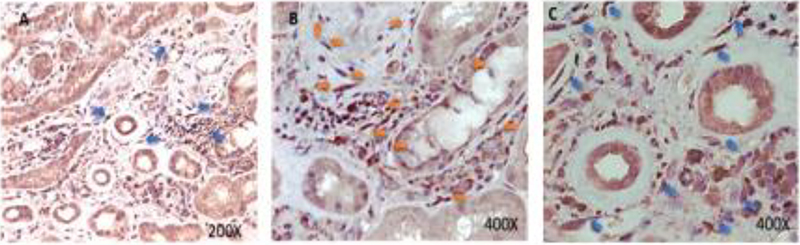
Figure 7. Interstitial fibrosis in diabetic nephropathy. Immunohistochemistry results of kidneys from patients with diabetic nephropathy demonstrating positive interstitial and peritubular cells for procollagen-1 in kidney biopsies of diabetic patients with advanced diabetic nephropathy.
These findings provide evidence that macrophages with a profibrotic phenotype are present in human diabetic kidney tissue and may contribute to the progression of renal interstitial fibrosis and glomerulosclerosis.
Changes in intracellular catalytic iron levels in human PBMCs after pretreatment with DFP and GLUC and Ang II treatment. Iron, an essential nutrient, can be harmful in excess by increasing cellular oxidative stress.18 We measured catalytic iron in the culture medium after treatment. We examined the effect of GLUC and of GLUC with Ang II on catalytic iron. As shown in Figure 8A, GLUC alone significantly (p < 0.0002) increased catalytic iron release. The catalytic iron content of the collected medium in the GLUC and Ang II groups was significantly higher (94.5 ± 14.01 nmol/ml ) than in the untreated group (12.4 ± 4.3 nmol/ml) and in GLUC alone (28.2 ± 6.1 nmol/ml) (Figure 8A, p < 0.0001). Pretreatment with 25 µM deferiprone for 24 h significantly (p < 0.0001) decreased catalytic iron release in cells treated with either GLUC alone or with GLUC and Ang II combined (Figure 8A). Catalytic iron levels were reduced to 15.5±2.6 nmol/ml compared with all treatment groups (28.2 ± 6.1 and 94.5 ± 14.01 nmol/ml, GLUC and GLUC+Ang II respectively ). GLUC or GLUC+Ang II induced expression of the iron regulatory proteins HO-1 and FPN, as observed by immunofluorescence staining (Figure 8B) and western blots (Figure 5). Pretreatment of PBMCs with 25 µM of DFP markedly reduced these expressions (Figures 5 and 8B). Overall, our results demonstrate that high GLUC and Ang II drive macrophage phenotype development, and that iron, specifically catalytic iron, plays an important role in glucose- and Ang II-driven renal fibrosis.
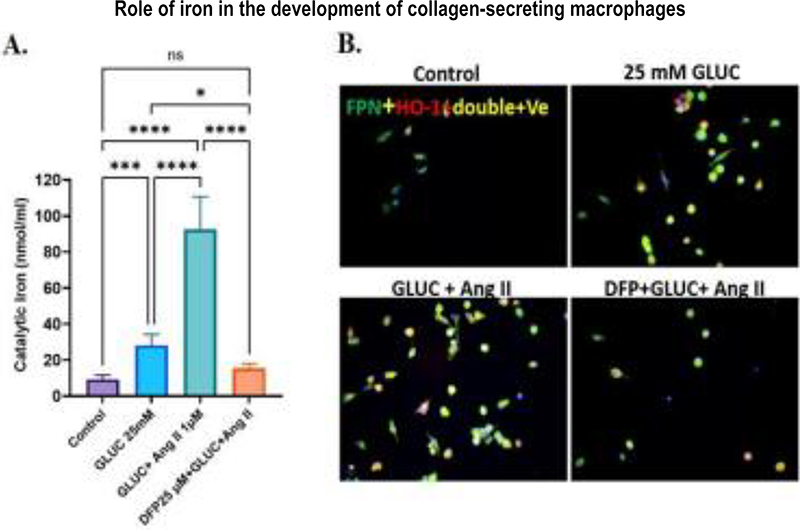
Figure 8. Panel A. Deferiprone treatment decreases the release of catalytic iron from glucose- and angiotensin-treated human PBMCs, as shown by a bleomycin-detectable iron assay. At the end of the experiments, the cell culture supernatant was collected for the measurement of bleomycin-detectable iron. One-way ANOVA followed by the Tukey-Kramer test was applied to compare groups. Values are means ±SD, N = 4,*P < 0.013, ***P < 0.0002, ****P < 0.0001, deferiprone-treated compared with glucose alone and with angiotensin, respectively. B. Immunofluorescence staining revealed that adherent and differentiated PBMCs are highly reactive with the iron exporter marker ferroportin (FPN). Increased heme oxygenase (HO-1) expression under high glucose, combined with Ang II, suggests greater oxidative stress and inflammation, which are relevant to diabetic complications. DFP pretreatment significantly decreased the number of FPN- and HO-1-positive cells and shows the important role of iron in diabetic nephropathy.
DISCUSSION
Diabetic nephropathy (DN), or diabetic kidney disease (DKD), remains a major cause of chronic kidney disease and end-stage kidney disease. Although hyperglycemia and activation of the renin–angiotensin system are established drivers of renal injury, increasing evidence indicates that inflammatory cells, particularly macrophages, contribute to progressive renal fibrosis and loss of kidney function.19 Macrophage accumulation in diabetic kidneys is associated with renal injury and fibrosis, and the diabetic renal microenvironment strongly shapes macrophage phenotype.2,19–22 Our findings identify a potential link among hyperglycemia, angiotensin II (Ang II), macrophage catalytic iron, and a profibrotic/proangiogenic macrophage phenotype.
A major finding of this study is that high glucose increased the number of CD163+ and CD68+-macrophages derived from human PBMCs and promoted procollagen-1 and ferroportin expression. Ang II further enhanced these effects. These findings are consistent with the established role of the renin–angiotensin system in promoting oxidative stress, inflammation, macrophage activation, and fibrosis in diabetic kidney disease. Macrophages can interact with renal cells and contribute to inflammatory and fibrotic responses through cytokine production, extracellular matrix remodeling, and macrophage–myofibroblast interactions.2,23 Importantly, the macrophages identified in our study should not necessarily be classified according to the conventional M1/M2 paradigm. Macrophage populations in diabetic kidneys are heterogeneous and highly plastic, and their phenotypes are determined by the local microenvironment.22–23 We therefore characterize the CD163-positive/procollagen-1-positive cells observed in our study as profibrotic macrophages. The detection of CD163-positive macrophages and procollagen-1-positive cells in human diabetic kidney tissue provides pathological support for this phenotype’s relevance. The predominance of procollagen-positive cells in the interstitium is particularly important because tubulointerstitial fibrosis is strongly associated with progressive renal dysfunction.
CATALYTIC IRON LINKS DIABETES TO MACROPHAGE ACTIVATION
Swaminathan et al. highlighted the potential role of iron in diabetic complications, emphasizing the importance of iron-mediated oxidative injury and the pathogenic potential of catalytic or redox-active iron in diabetes and its complications.11 Because catalytic iron can participate in free-radical reactions, even localized increases in redox-active iron may promote oxidative tissue injury without requiring systemic iron overload.
Our findings extend this concept by identifying macrophages as a potential cellular source, both intra- and extracellular, for catalytic iron accumulation under diabetic conditions. High glucose markedly increased catalytic iron levels in PBMC-derived macrophages, and Ang II further enhanced this response. Importantly, increased catalytic iron was accompanied by elevated procollagen-1 expression and angiogenic markers. These observations suggest that catalytic iron may contribute to macrophage functional transformation rather than merely reflecting a consequence of inflammation.
Macrophages are central to iron recycling because they phagocytose senescent erythrocytes and process heme-derived iron. The increased ferroportin expression observed in our cultures may reflect a compensatory response to elevated intracellular iron or altered iron flux. Further studies examining ferritin, transferrin receptor, heme oxygenase-1, hepcidin, and labile iron pools will be needed to determine how hyperglycemia and Ang II alter macrophage iron homeostasis. Our findings are also consistent with emerging evidence linking iron dysregulation to diabetic kidney injury. Recent studies have implicated iron-dependent oxidative injury and ferroptosis in DKD.22,24–25 However, our findings do not establish ferroptosis as the underlying mechanism. Rather, they support a broader role for catalytic iron and iron-associated oxidative stress in macrophage activation and in profibrotic signaling.
IRON CHELATION SUPPRESSES THE PATHOGENIC MACROPHAGE PHENOTYPE
An important mechanistic observation was that pretreatment with the iron chelator deferiprone significantly reduced the number of adherent macrophages and decreased the number of procollagen-1-positive cells induced by high glucose and Ang II. Deferiprone also reduced lectin and acetylated LDL expression, indicating suppression of the proangiogenic phenotype. These findings provide functional evidence that free iron, or redox-active iron, contributes to the macrophage response. They are conceptually consistent with earlier reports highlighting the potential role of catalytic iron in diabetic complications and the therapeutic rationale for iron chelation.11
However, our study extends this concept by suggesting that iron chelation can alter macrophage phenotypic behavior, particularly their collagen-positive and proangiogenic properties. We propose that hyperglycemia and Ang II may establish a feed-forward pathway in which hyperglycemia and Ang II promote macrophage activation, leading to increased catalytic iron, oxidative stress, and a procollagen-1-positive/proangiogenic macrophage phenotype that may contribute to renal fibrosis. In this model, catalytic iron may serve as a convergence point between metabolic and renin–angiotensin stress.
PROFIBROTIC AND ANGIOGENIC MACROPHAGES IN DIABETIC KIDNEY DISEASE
The increased expression of lectin and acetylated LDL suggests that procollagen-1-positive macrophages generated under hyperglycemic and Ang II conditions also acquire proangiogenic properties. Macrophages are key regulators of angiogenesis and vascular remodeling and can influence extracellular matrix turnover and tissue repair. The simultaneous presence of collagen positivity and proangiogenic markers may therefore identify a particularly pathogenic macrophage population.
The reduction of both collagen and angiogenic markers after deferiprone treatment suggests that iron may contribute to the coordinated development of these macrophage functions. This finding may have therapeutic implications, as modifying macrophage iron metabolism could potentially suppress pathological macrophage activity without requiring nonspecific macrophage depletion.
RELEVANCE TO HUMAN DISEASE AND THERAPEUTIC IMPLICATIONS
The presence of CD163-positive macrophages and procollagen-1-positive cells in human diabetic kidney tissue supports the clinical relevance of our experimental findings. Although these observations are associative and do not establish that macrophages are the exclusive source of renal collagen, they demonstrate that macrophage-associated collagen production occurs within regions of human diabetic renal injury.
Current therapies for diabetic kidney disease (DKD) have substantially improved renal outcomes; however, many patients still progress to advanced kidney disease. Consequently, identifying pathways linking metabolic stress, inflammation, and fibrosis remains important. Our results suggest that modulating macrophage iron metabolism may represent a potential therapeutic strategy. Rather than eliminating macrophages, targeting catalytic iron could potentially suppress pathological macrophage functions while preserving beneficial macrophage activities.
LIMITATIONS AND FUTURE DIRECTIONS
Several limitations should be acknowledged. First, the PBMC culture system does not fully replicate the complexity of the diabetic kidney microenvironment. Interactions among macrophages, endothelial cells, tubular epithelial cells, podocytes, fibroblasts, and extracellular matrix components likely shape macrophage phenotypes in vivo. Second, the current study identifies a collagen-secreting macrophage phenotype but does not establish the precise molecular pathway by which catalytic iron induces this phenotypic shift. Third, although deferiprone provides functional evidence supporting a role for iron, iron chelation can affect multiple molecular targets, and additional approaches to manipulate macrophage iron homeostasis will be needed to establish the underlying mechanism. Finally, our data do not establish ferroptosis as the mechanism of macrophage injury or activation.
Future studies should therefore determine whether catalytic iron accumulation precedes the development of profibrotic macrophages in experimental diabetes and whether selectively manipulating macrophage iron handling attenuates renal fibrosis in vivo. Analysis of ferritin, transferrin receptor, ferroportin/hepcidin signaling, labile iron pools, lipid peroxidation, GPX4, and NRF2-dependent antioxidant pathways should help clarify the relationship between macrophage iron metabolism and oxidative injury. Single-cell and spatial approaches could further determine whether iron-associated macrophage populations are localized to regions of active fibrosis in human diabetic kidneys.
CONCLUSIONS
In summary, the present study identifies a potential mechanistic link among hyperglycemia, Ang II, macrophage iron metabolism, and renal fibrosis. We demonstrate that hyperglycemic conditions, particularly in the presence of Ang II, increase catalytic iron levels and promote the emergence of macrophages expressing procollagen-1 and proangiogenic markers. Deferiprone reduces these phenotypic changes, providing functional evidence that iron availability contributes to the macrophage response.
These findings extend the concept established by Swaminathan et al. that catalytic iron can contribute to diabetic tissue injury by proposing a specific cellular mechanism in which redox-active iron may drive a profibrotic and proangiogenic macrophage phenotype in diabetic kidney disease. The identification of CD163-positive and procollagen-1-positive cells in human diabetic kidney tissue further supports the potential relevance of this pathway to human disease. Targeting macrophage iron dysregulation may therefore offer a novel strategy to interrupt the transition from metabolic and inflammatory stress to renal fibrosis and progressive kidney dysfunction.
Previous studies have established a role for catalytic iron in diabetic complications; our study identifies catalytic iron within macrophages as a potential driver of a collagen-positive, angiogenic macrophage phenotype under hyperglycemic and Ang II conditions and demonstrates that iron chelation suppresses this phenotype.
FUNDING
This work was supported by the University of Arkansas for Medical Sciences Translational Research Institute (TRI) UL1TR000039 (SS). The VA Merit Review Grant (SVS), the Department of Veterans Affairs, Veterans Health Administration, Office of Research and Development, and the Sturgis Diabetes Foundation grant UAMS (CB) also supported part of the work.
DATA AVAILABILITY
All data are provided in the manuscript.
CONFLICT OF INTEREST STATEMENT
Competing Interests: The authors declare no competing interests.
ACKNOWLEDGMENT
We thank Dr. Judit Megyesi, UAMS, for assistance with immunofluorescence microscopy
AUTHOR CONTRIBUTIONS
SS and SVS: Conceptualization; Funding acquisition; Investigation; Project administration; Resources; Supervision; Writing – review & editing. CB: Funding acquisition; Data curation; Formal analysis; Investigation; Methodology; Writing original draft; review & editing. NG: IHC for human kidney biopsies. OK: Catalytic iron assay; review and editing. AA, GJ and SB: review and editing.
ETHICS STATEMENT
The study was performed in accordance with the institution’s ethical standards and the Declaration of Helsinki. For Patients’ kidney biopsies, approval from the Institutional Review Board of the University of Arkansas for Medical Sciences (UAMS) was obtained.
REFERENCES
- Jha R, Lopez-Trevino S, Kankanamalage HR, et al. Diabetes and Renal Complications: An Overview on Pathophysiology, Biomarkers and Therapeutic Interventions. Biomedicines. 2024;12(5):1098.
- Li HD, You YK, Shao BY, et al. Roles and crosstalk of macrophages in diabetic nephropathy. Front Immunol. 2022; 13:1015142, PMID: 36405700.
- Xu L, Kanasaki K, Kitada M, et al. Diabetic angiopathy and angiogenic defects. Fibrogenesis Tissue Repair. 2012;5(1):13.
- Hou R, Gao L, Long J, et al. Identification of fibrotic biomarkers associated with macrophages in diabetic nephropathy. Med Sci Monit. 2023:29:e940847.
- Youssef N, Noureldein MH, Riachi ME, et al. Macrophage polarization and signaling in diabetic kidney disease: a catalyst for disease progression. Am J Physiol Renal Physiol. 2024;326(3):F301–F312.
- Duran-Salgado MB, Rubio-Guerra AF. Diabetic nephropathy and inflammation. World J Diabetes. 2014;5(3):393–8. PMID: 24936261.
- Zhang A, Fang H, Chen J, et al. Role of VEGF-A and LRG1 in abnormal angiogenesis associated with diabetic nephropathy. Front Physiol. 2020;11:1064.
- Hu S, Hang X, Wei Y, et al. Crosstalk among podocytes, glomerular endothelial cells and mesangial cells in diabetic kidney disease: an updated review. Cell Commun Signal. 2024;22(1):136.
- Gaydarski L, Petrova K, Angushev I, et al. Exploring the molecular modalities in the pathogenesis of diabetic kidney disease with a focus on the potential therapeutic implications. Biomedicines. 2024;13(1):50.
- Kumar R, Kulshreshtha D, Aggarwal A, et al. Glucose induced regulation of iron transporters implicates kidney iron accumulation. Biochim Biophys Acta Gen Subj. 2024; 1868(11):130713.
- Martines A, Masereeuw R, Tjalsma H, et al. Iron metabolism in the pathogenesis of iron-induced kidney injury. Nat Rev Nephrol. 2013;9(7):385–98. PMID: 23670084.
- Swaminathan S, Fonseca VA, Alam MG, et al. The role of iron in diabetes and its complications. Diabetes Care. 2007; 30(7):1926–33.
- Wang M, Ying Q, Li Q, et al. Macrophage Iron Metabolism Mediates Immunometabolic Reprogramming and Tissue Homeostasis: From Molecular Mechanisms to Clinical Translation. Cells; 2026;15(10):895.
- Pietrangelo A. Ferroportin disease: pathogenesis, diagnosis and treatment. Haematologica. 2017;102(12):1972–84.
- Chaudhary K, Chilakala A, Ananth S, et al. Renal iron accelerates the progression of diabetic nephropathy in the HFE gene knockout mouse model of iron overload. Am J Physiol Renal Physiol. 2019;317(2):F512–F517.
- Zhao H, Guo J. Macrophages in Focus: Key Drivers and Therapeutic Opportunities in Diabetic Kidney Disease. Int J Biol Sci. 2025;21(10):4647–62.
- Muona P, Peltonen J, Jaakkola S, et al. Increased matrix gene expression by glucose in rat neural connective tissue cells in culture. Diabetes. 1991;40(5):605–11.
- Baliga R, Ueda N, Shah SV. Increase in bleomycin-detectable iron in ischemia/reperfusion injury to rat kidneys. Biochem J. 1993;291(Pt 3):901–5. PMID: 7683877.
- Obeagu EI. Iron homeostasis and health: understanding its role beyond blood health – a narrative review. Ann Med Surg (Lond). 2025; 21;87(6):3362–71.
- Ouyang JF, Mishra K, Xie Y, et al. Systems-level identification of a matrisome-associated macrophage polarisation state in multi-organ fibrosis. Elife. 2023;12:e85530.
- Song Y, Ye L, Zhou H, et al. Macrophages at the Core: Metabolic shifts and renal cell cross-talk as key mediators in diabetic nephropathy. Biochem Pharmacol. 2026;248:117869.
- Huang Y, Sun Y, Guo D, et al. CXCL6 Orchestrates Macrophage-Driven Inflammation in Diabetic Kidney Disease and Represents a Druggable Target. Kidney Dis (Basel). 2025;11(1):812–34. PMID: 41321788.
- Yan J, Li X, Liu N, et al. Relationship between Macrophages and Tissue Microenvironments in Diabetic Kidneys. Biomedicines. 2023;11(7):1889. PMID: 37509528.
- Mengstie MA, Abdu Seid M, Gebeyehu NA, et al. Ferroptosis in diabetic nephropathy: Mechanisms and therapeutic implications. Metabol Open. 2023;18:100243.
- Wang H, Liu D, Zheng B, et al. Emerging Role of Ferroptosis in Diabetic Kidney Disease: Molecular Mechanisms and Therapeutic Opportunities. Int J Biol Sci. 2023; 19(9):2678–94. PMID: 37324941.
- Mu F, Luo P, Zhu Y, et al. Iron Metabolism and Ferroptosis in Diabetic Kidney Disease. Cell Biochem Funct. 2025;43(4):e70067. PMID: 40166850.
Article citation: Bose C, Karaduta O, Golden N, Alapati A, Jumayeva G, Banerjee, Shah S, Sundararaman S. Role of Iron in Collagen-expressing Proangiogenic Macrophages in Diabetic Nephropathy. The Southwest Journal of Medicine. 2026;14(61):21–35
From: Department of Pharmacology and Neuroscience, Garrison Institute on Aging, Texas Tech University Health Sciences Center, Lubbock, TX, Center of Excellence for Translational Neuroscience and Therapeutics, Texas Tech University Health Sciences Center, Lubbock, TX (CB), Central Arkansas John L. McClellan Memorial Veterans Healthcare System, Renal Section, Medicine Service, Little Rock, Arkansas, University of Arkansas for Medical Sciences, Internal Medicine, Division of Nephrology, Little Rock, Arkansas, USA (CB, OK, SS, SS), University of Arkansas for Medical Sciences, Department of Pathology, Little Rock, Arkansas (NG), Internal Medicine, Texas Tech University Health Sciences Center, Lubbock, TX (GJ, AA), School of Medicine, Texas Tech University Health Sciences Center, Lubbock, TX, USA (SB)
Conflicts of interest: none
This work is licensed under a Creative Commons Attribution-ShareAlike 4.0 International License.