Abstract
Ventricular arrhythmias in type 2 myocardial infarction: Incidence and in-hospital outcomes: A national inpatient analysis (2017–2022)
Chanokporn Puchongmart MD, Koravich Lorlowhakarn MD, Ben Thiravetyan MD, Panat Yanpiset MD, Thanaboon Yinadsawaphan MD, Narathorn Kulthamrongsri, MD, Mahmood Abdelnabi, MD, Natnicha Leelaviwat MD, Ankush Lahoti, MD
Corresponding author: Koravich Lorlowhakarn
Contact Information: Koravich.Lorlowhakarn@bmc.org
DOI: 10.12746/swjm.v14i59.1619
ABSTRACT
Background: Ventricular arrhythmias, including ventricular tachycardia and ventricular fibrillation, are well-known contributors to adverse outcomes in type 1 myocardial infarction, but their significance in type 2 myocardial infarction remains underexplored.
Objective: We investigated the incidence of ventricular arrhythmias and their association with clinical outcomes among patients with type 2 myocardial infarction.
Methods: This retrospective cohort study utilized the National Inpatient Sample (2017–2022) and included adults hospitalized for type 2 myocardial infarction. Ventricular arrhythmias were identified using ICD-10-CM codes. Multivariable models were adjusted for patients’ demographics and comorbidities and employed to identify predictive factors for in-hospital mortality, length of stay, and total hospital charges.
Results: A total of 2,016,430 patients were included, and 5.89% developed ventricular arrhythmias. Patients with ventricular arrhythmias were younger (69.5 vs. 70.6 years, p < 0.01), less female (33.4% vs. 47.9%, p < 0.01), and more frequently African American (20.1% vs 17.0%, p < 0.01). Ventricular arrhythmias were associated with significantly increased in-hospital mortality (19.3% vs. 9.2%, p < 0.01), prolonged hospital length of stay (7 vs 5 days), and higher total hospital charges ($99,437 vs. $60,297 p < 0.01). Adjusted multivariate models demonstrated ventricular arrhythmias as an independent predictor for in-hospital mortality (aOR 2.39, 95% CI 2.31–2.48), longer length of stay (β 2.83 days, 95% CI 2.66–3.00), and higher total hospital charges (cost ratio 1.60, 95% CI 1.57–1.63).
Conclusion: The incidence of ventricular arrhythmias is notable among hospitalized patients with type 2 myocardial infarction is associated with significantly worse clinical and economic outcomes.
Keywords: Type 2 myocardial infarction; ventricular tachycardia; ventricular fibrillation; mortality
INTRODUCTION
“Myocardial infarction” (MI) remains one of the leading causes of death and long-term morbidity in the United States.1 According to the Fourth Universal Definition of MI, a diagnosis requires a positive high-sensitivity cardiac troponin above the 99th percentile and least one of the following criteria: (1) symptoms of ischemia, (2) new ischemic changes on electrocardiogram, (3) development of pathological Q waves, (4) new regional wall motion abnormalities on imaging in a vascular territory, or (5) evidence of coronary thrombus on angiography. Patients who exhibit elevated troponin levels without meeting these criteria are classified as having “acute myocardial injury.”2
Type 2 myocardial infarction (T2MI) is characterized by acute myocardial injury resulting from an imbalance between myocardial oxygen supply and demand. This distinguishes it from type 1 myocardial infarction (T1MI), which is caused by acute coronary artery occlusion due to atherosclerotic plaque rupture. In this new definition of the MI era, T2MI diagnoses prevalence has been rising and accounts for nearly half of all MIs, and its mortality rates are comparable or higher to those of T1MI.3 Despite this high mortality rate, patients with T2MI tend to receive more conservative treatment approaches based on its pathophysiology and experience worse short- and long-term outcomes compared to those with T1MI.
Ventricular arrhythmias (VAs) such as ventricular tachycardia (VT) and ventricular fibrillation are well-documented as complications of T1MI.4 These arrhythmias often occur during the acute phase due to transmural ischemia, causing automaticity, enhanced reentrant activity, and cardiac re-entry,5 and have been identified as independent predictors of in-hospital mortality and sudden cardiac death in T1MI patients.5–8
Type 2 myocardial infarction is believed to be precipitated by patients’ systemic conditions, such as sepsis, hypoxia, hypotension, anemia, coronary spasm, dissection, or embolism, which lead to diffuse subendocardial ischemia rather than full-thickness myocardial necrosis.9 Nonetheless, these systemic derangements may predispose to electrical instability when triggered by autonomic dysregulation, electrolyte imbalance, and transient ischemia.10,11 Ventricular arrhythmias in T2MI could potentially be reversible with the correction of the underlying illnesses, as the risk of developing VAs among T1MI within 48 hours has significantly declined over the past decades due to timely revascularization from a decrease in the area of myocardial infarction.12,13
To our knowledge, the incidence, risk factors, and prognostic implications of VAs in T2MI are less well studied. This study aims to evaluate the incidence of VAs in patients with type 2 myocardial infarction and their association with in-hospital outcomes.
METHODS
We conducted a retrospective cohort study using the National Inpatient Sample (NIS) from 2017 to 2022. The NIS, part of the Healthcare Cost and Utilization Project (HCUP), is the largest publicly available all-payer inpatient database in the United States, providing a 20% stratified sample of discharges from U.S. community hospitals. We included adult patients aged ≥18 years who were hospitalized with a principal or secondary diagnosis of T2MI, identified using the International Classification of Diseases, Tenth Revision, Clinical Modification (ICD-10-CM) diagnosis code I21.A1, myocardial infarction type 2, and code I5A. Patients with missing data for key variables, e.g., age, sex, mortality, race, length of stay, or total charges, were excluded. The primary exposure was a diagnosis of VAs, defined as the presence of ICD-10-CM codes I472, ventricular tachycardia, I4901, ventricular fibrillation, and I4902, ventricular flutter in any diagnosis field. Covariates, including age, sex, race, comorbidity burden, and diagnoses of potential causes of myocardial injury, were collected. Comorbidities were measured using individual Elixhauser comorbidity flags defined by HCUP software.
OUTCOMES
The primary outcome was the incidence of VAs among patients hospitalized with T2MI. Secondary outcomes included in-hospital mortality, LOS, and THC, defined as inflation-adjusted to 2022 U.S. dollars using the Consumer Price Index for medical care services, as reported by the U.S. Bureau of Labor Statistics.
STATISTICAL ANALYSIS
We applied survey weights, stratification, and clustering to all analyses to generate national estimates per HCUP guidelines. Descriptive statistics summarized baseline characteristics between T2MI patients with and without VAs. Continuous variables were reported as means ± standard deviations or medians with interquartile ranges, based on the data distribution. Categorical variables were summarized as weighted percentages. Characteristics between patients with and without VAs were compared using design-based F tests from a survey-adjusted chi-square test. Continuous variables were reported as means with standard deviations or medians with interquartile ranges and compared using survey-weighted linear regression.
Multivariable logistic regression was used to estimate the adjusted odds for in-hospital mortality associated with VAs. Generalized linear models with a gamma distribution and log link were used to identify predictors for increased THC, and linear regression was used for LOS. Confidence intervals and p-values <0.05 were considered statistically significant. All analyses were performed using Stata version 18.0 (StataCorp, College Station, TX).
RESULTS
A total of 2,016,430 hospitalized patients were included for analysis. Of these, 5.89% developed VAs. Baseline demographic characteristics are summarized in Table 1. Patients with VAs were slightly younger than those without (69.5 vs. 70.6 years, p < 0.01) and were less likely to be female (33.4% vs. 47.9%, p < 0.01). Significant differences in racial distribution were observed (p < 0.01). Although White patients comprised the majority in VAs and non-VAs groups, the proportions were comparable (67.5% vs. 67.6%). However, African American patients were more prevalent in the VA group compared to those without VAs (20.1% vs. 17.0%). Significant differences in comorbidities were observed between the two groups except for hypertension, obesity, and history of drug abuse. Patients with VAs exhibited higher proportion of congestive heart failure (76.0% vs. 56.6%, p < 0.01), followed by chronic kidney disease (41.8% vs. 40.1%, p < 0.01), peripheral vascular disease (19.8% vs. 12.1%, p < 0.01), pulmonary circulation disorder (18.1% vs. 15.4%, p < 0.01), liver disease (13.7% vs. 9.2%, p < 0.01), and alcohol use disorder (6.5% vs. 5.6%, p < 0.01), respectively. In contrast, diabetes mellitus, chronic pulmonary disease, hypothyroidism, cancer, and rheumatoid arthritis were more frequently observed among patients without VAs, as shown in Table 1. Percutaneous coronary interventions were also found to be significantly different between VAs and non-VAs (2.3% vs. 1.0%, p < 0.01).
Table 1. Baseline Characteristics of T2MI Patients With and Without VAs
| Characteristics |
Ventricular Arrhythmias (N = 118,765) |
No Ventricular Arrhythmias (N = 1,897,665) |
p-value |
| Incidence, % |
5.89 |
94.11 |
|
| Age, year |
69.5±0.1 |
70.6±0.1 |
<0.01 |
| Female, % |
33.4 |
47.9 |
<0.01 |
| Race, % |
|
|
<0.01 |
| White |
67.5 |
67.6 |
|
| Black |
20.1 |
17.0 |
|
| Hispanic |
7.2 |
9.2 |
|
| Asian or Pacific islander |
2.1 |
2.8 |
|
| Native American |
0.6 |
0.8 |
|
| Others |
2.5 |
2.6 |
|
| Comorbidities, % |
| Hypertension |
81.2 |
81.4 |
0.75 |
| Congestive Heart Failure |
76.0 |
56.6 |
<0.01 |
| Diabetes Mellitus |
40.4 |
41.7 |
<0.01 |
| Chronic Kidney Disease |
41.8 |
40.1 |
<0.01 |
| Chronic Pulmonary Disease |
30.6 |
31.9 |
<0.01 |
| Valvular Heart Disease |
22.8 |
18.7 |
<0.01 |
| Obesity |
19.6 |
19.1 |
0.10 |
| Peripheral Vascular Disease |
19.8 |
12.1 |
<0.01 |
| Pulmonary Circulation Disorders |
18.1 |
15.4 |
<0.01 |
| Liver Disease |
13.7 |
9.2 |
<0.01 |
| Hypothyroidism |
12.5 |
15.8 |
<0.01 |
| Cancer |
7.3 |
8.3 |
<0.01 |
| Drug Abuse |
7.1 |
6.8 |
0.20 |
| Alcohol Abuse |
6.5 |
5.6 |
<0.01 |
| Rheumatoid Arthritis/Collagen Vascular Diseases |
2.8 |
4.0 |
<0.01 |
| Causes of secondary myocardial injury, % |
| Respiratory Failure |
51.8 |
43.5 |
<0.01 |
| Hypotension or shock |
28.6 |
15.4 |
<0.01 |
| Sepsis |
18.8 |
11.6 |
<0.01 |
| Anemia |
8.0 |
8.7 |
<0.01 |
| Coronary Artery Dissection |
0.1 |
0.1 |
<0.01 |
| Coronary Spasm without atherosclerosis |
0.1 |
0.1 |
0.28 |
| Percutaneous Coronary Intervention |
2.3 |
1.0 |
<0.01 |
In unadjusted analyses, T2MI patients with VAs had significantly higher in-hospital mortality (11.5% vs. 5.2%, p < 0.01), longer median LOS (7 vs. 5 days, p < 0.01), and greater THC ($99,916 vs. $60,446, p < 0.01), as shown in Table 2. Causes of secondary myocardial injury were found to be highest in respiratory failure (51.8% vs. 43.5%, p < 0.01), hypotension or shock (28.6% vs. 15.4%, p < 0.01), sepsis (18.8% vs. 11.6%, p < 0.01), anemia (8.0% vs. 8.7%, p < 0.01), coronary artery dissection (0.1% vs. 0.1%, p < 0.01), and coronary spasm (0.1% vs. 0.1%, p = 0.28) in VAs and non-VAs, respectively, as shown in Figure 1.
Table 2. Unadjusted Outcomes Among Patients With and Without VAs
| Outcomes |
Ventricular Arrhythmias (N = 118,765) |
No Ventricular Arrhythmias (N = 1,897,665) |
p-value |
| In-hospital Mortality, % |
19.3 |
9.2 |
<0.01 |
| Length of stay, d (median, IQR) |
7 (4–13) |
5 (3–9) |
<0.01 |
| Total Hospital Charges, $ (median, IQR) |
99,437 (48,323–206,782) |
60,297 (33,113–116,912) |
<0.01 |
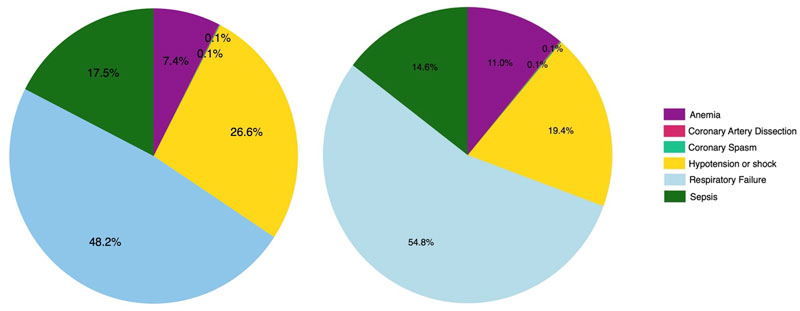
Figure 1 Causes of secondary myocardial injury in patients. Left: with ventricular arrhythmias, Right: without ventricular arrhythmias.
In multivariable regression models, VAs was independently associated with increased odds of in-hospital mortality (aOR 2.39, 95% CI: 2.31–2.48), longer LOS (β = 2.83 days, 95% CI: 2.66–3.00), and higher THC (cost ratio 1.60, 95% CI: 1.57–1.63). Age was associated with slightly increased odds of in-hospital mortality (aOR 1.02, 95% CI: 1.02–1.02). Female sex was associated with favorable outcomes, including lower in-hospital mortality (aOR 0.91, 95% CI: 0.89–0.93), slightly shorter LOS (β = –0.14 days, 95% CI: –0.21 to –0.08), and reduced THC (cost ratio 0.95, 95% CI: 0.94–0.96). African American patients demonstrated protective effects against adverse outcomes, with lower odds of in-hospital mortality (aOR 0.93, 95% CI: 0.90–0.96) and shorter LOS (β = 0.48 days, 95% CI: 0.37–0.59). Comorbidities associated with increased in-hospital mortality and were identified as independent risk factors included liver disease (aOR 3.58, 95% CI: 3.47–3.70), cancer (aOR 1.69, 95% CI: 1.63–1.74), and pulmonary circulation disorder (aOR 1.15, 95% CI: 1.11–1.19). In contrast, other comorbidities appear to be protective factors against in-hospital mortality, such as congestive heart failure, diabetes mellitus, chronic kidney disease, valvular heart disease, obesity, hypothyroidism, drug abuse, and alcohol abuse. In addition, peripheral vascular disease, hypothyroidism, alcohol abuse, and rheumatologic diseases did not show significant differences in terms of in-hospital mortality, as shown in Table 3 and Figure 2.
Table 3. Adjusted Outcomes Associated with and without VAs
| Predictors |
In-hospital Mortality (aOR, 95% CI) |
LOS (β, 95% CI) |
Adjusted Inflation Charges (CR, 95% CI) |
| Ventricular arrhythmias |
2.39 (2.31–2.48) |
2.83 (2.66–3.00) |
1.60 (1.57–1.63) |
| Age, year |
1.02 (1.02–1.02) |
−0.20 (−0.02 to −0.02) |
0.99 (0.99–0.99) |
| Female |
0.91 (0.89–0.93) |
−0.14 (−0.21 to −0.08) |
0.95 (0.94–0.96) |
| Race |
| White |
Reference group |
| Black |
0.93 (0.90–0.96) |
0.48 (0.37–0.59) |
1.07 (1.05–1.10) |
| Hispanic |
1.16 (1.11–1.20) |
0.55 (0.41–0.70) |
1.42 (1.38–1.47) |
| Asian or Pacific islander |
1.16 (1.09–1.23) |
0.98 (0.73–1.22) |
1.47 (1.41–1.52) |
| Native American |
1.14 (0.99–1.31) |
0.19 (−0.13–0.53) |
0.94 (0.88–1.00) |
| Others |
1.25 (1.17–1.34) |
1.06 (0.82–1.30) |
1.48 (1.42–1.55) |
| Comorbidities |
| Congestive Heart Failure |
0.92 (0.91–0.94) |
0.68 (0.62–0.76) |
1.05 (1.04–1.06) |
| Diabetes Mellitus |
0.85 (0.84–0.86) |
−0.05 (−0.12–0.01) |
0.98 (0.97–0.99) |
| Chronic Kidney Disease |
0.95 (0.93–0.98) |
0.24 (0.17 to 0.31) |
0.97 (0.96–0.98) |
| Chronic Pulmonary Disease |
0.96 (0.93–0.98) |
−0.33 (−0.40 to −0.27) |
0.92 (0.92–0.94) |
| Valvular Heart Disease |
0.64 (0.62–0.66) |
−0.89 (−0.97 to −0.83) |
0.90 (0.89–0.91) |
| Peripheral Vascular Disease |
0.86 (0.83–0.89) |
−0.43 (−0.51 to −0.35) |
0.99 (0.98–1.01) |
| Pulmonary Circulation Disorders |
1.15 (1.11–1.19) |
0.89 (0.81–0.99) |
1.11 (1.10–1.13) |
| Liver Disease |
3.58 (3.47–3.70) |
2.36 (2.23–2.49) |
1.51 (1.48–1.54) |
| Hypothyroidism |
0.83 (0.81–0.86) |
−0.54 (−0.61 to −0.47) |
0.91 (0.90–0.92) |
| Cancer |
1.69 (1.63–1.74) |
1.02 (0.92 to 1.14) |
1.16 (1.14–1.19) |
| Alcohol Abuse |
0.68 (0.60–0.66) |
−0.24 (−0.39 to −0.09) |
0.90 (0.88–0.92) |
| Rheumatoid Arthritis/Collagen Vascular Diseases |
0.95 (0.90–1.01) |
0.05 (−0.08–0.19) |
0.99 (0.97–1.01) |
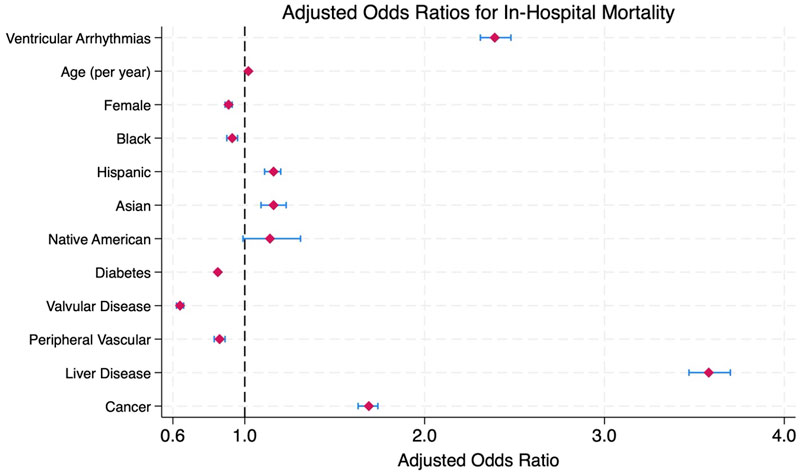
Figure 2 Adjusted odds ratios for in-hospital mortality for patients with type 2 myocardial infarction.
DISCUSSION
This is the first nationally representative study to characterize the incidence of VAs, including VT and VF, in hospitalized T2MI. We found that 5.89% of hospitalized T2MI patients developed VAs during hospitalization. These patients were significantly younger, predominantly male, and had significant worsening in-hospital outcomes, including over two-fold higher in-hospital mortality, longer LOS, and greater THC.
VAs are known to be common complications following acute myocardial infarction caused by biological and electrophysiological disturbances of the heart after ischemia.14 In T1MI, the VAs prevalence ranged between 4.6% and 10%, with a higher incidence observed in those who underwent coronary reperfusion therapy.4–6,8,15 In comparison, our study showed that the overall incidence of VAs among individuals with T2MI was 5.89%. This result confirms that the prevalence of VAs among T2MI is comparable to that of patients with T1MI.4,16
Our study also reported a similar pattern of mortality rates between T1MI and T2MI, as observed in previous studies.3,14,17 Specifically, the in-hospital mortality rate in T2MI or non-ischemic myocardial injury in our cohort was higher than in an earlier study by McCarthy and coauthors (19.3% vs 8.9%).3 This discrepancy may reflect the evolving trends in the diagnosis of T2MI, as well as the widespread adoption of high-sensitivity troponin assays, which may have increased the detection of clinically significant T2MI.18
VAs have been well-studied in the context of T1MI and are recognized as independent predictors of adverse short- and long-term outcomes. Prior research has shown that the odds of in-hospital mortality are significantly elevated in T1MI patients with VAs. For instance, an odds ratio of 2.99 was reported in T1MI patients with heart failure with preserved ejection fraction. Similarly, intensive care unit admissions with VT demonstrated an odds ratio of 3.53, and late-onset VAs have been associated with an increased odds ratio up to 6.40.8,15,19,20 Furthermore, the one-year mortality odds in these patients have been reported as high as 6.65.21 However, these risks can be substantially mitigated through timely revascularization, which has been shown to normalize long-term outcomes by prior studies by Demidova and Bougouin and co-authors following ST-segment elevation myocardial infarction.22,23 In our analysis, patients with T2MI or non-ischemic myocardial injury who developed VAs during hospitalization had a significantly increased risk of in-hospital mortality, with an adjusted odds ratio of 2.39. While this effect size was lower than those observed in T1MI cohorts, it remains clinically significant. The difference in magnitude may be partly attributable to diagnostic heterogeneity in our cohort. Given prior research by Saaby et al. demonstrating that nearly 50% of T2MI cases identified through ICD-10 codes were misclassified, the use of administrative coding alone cannot reliably distinguish T2MI from non-ischemic myocardial injury. As such, T2MI diagnoses based solely on ICD-10 codes should be interpreted with caution in epidemiological analyses.9 However, this elevated risk of VAs and in-hospital mortality phenomenon may also reflect ongoing myocardial injury that remains insufficiently addressed or treated, or the under recognition of clinically significant coronary artery disease in T2MI patients, which could remain prevalent due to high cardiovascular risk factors despite lower rates of coronary angiography and revascularization being performed (1.0 to 2.2%).14
To our knowledge, the trend in diagnosing T2MI is increasing. Despite the mortality burden, prolonged hospitalization, and increased healthcare costs, studies in the field of T2MI remain limited. Future studies focused on diagnosis, risk stratification, and management are essential to guide and help improve clinical outcomes in especially high-risk patients.
LIMITATIONS
This study has several limitations. First, it is constrained by the administrative nature of the NIS. It is subject to coding errors or misclassification bias. Second, the diagnoses of T2MI and VAs were based on ICD-10-CM coding, which may complicate the differentiation between the incidence and prevalence of VAs among T2MI patients since some individuals may have had a diagnosis of VT/VF prior to hospitalization. Third, the NIS lacks detailed clinical information (e.g., ECG findings, lab values, VT/VF duration, or treatment) that might influence the clinical outcomes in this specific group of patients. Fourth, the NIS captures hospitalizations rather than individual patients, which introduces the possibility that some individuals may have been counted more than once if they were admitted multiple times during the study period. Last, causal inference between the presence of VA and the increase in in-hospital mortality cannot be established due to the observational design of this study.
CONCLUSIONS
Ventricular arrhythmias occur in a notable proportion of patients hospitalized for T2MI (5.89%). They are independently associated with adverse in-hospital outcomes, including increased mortality, prolonged LOS, and higher THC.
REFERENCES
- Ahmad FB, Cisewski JA, Xu J, et al. Provisional Mortality Data – United States, 2022. MMWR Morb Mortal Wkly Rep. 2023;72(18):488–92. DOI: 10.15585/mmwr.mm7218a3.
- Thygesen K, Alpert JS, Jaffe AS, et al. Fourth Universal Definition of Myocardial Infarction (2018). Circulation. 2018;138(20):e618–e651. DOI: 10.1161/CIR.0000000000000617.
- McCarthy CP, Kolte D, Kennedy KF, et al. Patient Characteristics and Clinical Outcomes of Type 1 Versus Type 2 Myocardial Infarction. Journal of the American College of Cardiology. 2021;77(7):848–57. DOI: 10.1016/j.jacc.2020.12.034.
- Mehta RH, Yu J, Piccini JP, et al. Prognostic significance of postprocedural sustained ventricular tachycardia or fibrillation in patients undergoing primary percutaneous coronary intervention (from the HORIZONS-AMI Trial). Am J Cardiol. 2012;109(6):805–12. DOI: 10.1016/j.amjcard.2011.10.043.
- Amin M, Kella D, Killu AM, et al. Sudden cardiac arrest and ventricular arrhythmias following first type I myocardial infarction in the contemporary era. J Cardiovasc Electrophysiol. 2019;30(12):2869–76. (In eng). DOI: 10.1111/jce.14218.
- Tran HV, Ash AS, Gore JM, et al. Twenty-five year trends (1986–2011) in hospital incidence and case-fatality rates of ventricular tachycardia and ventricular fibrillation complicating acute myocardial infarction. Am Heart J. 2019;208:1–10. DOI: 10.1016/j.ahj.2018.10.007.
- Maggioni AP, Zuanetti G, Franzosi MG, et al. Prevalence and prognostic significance of ventricular arrhythmias after acute myocardial infarction in the fibrinolytic era. GISSI-2 results. Circulation. 1993;87(2):312–22. DOI: 10.1161/01.cir.87.2.312.
- Harkness JR, Morrow DA, Braunwald E, et al. Myocardial ischemia and ventricular tachycardia on continuous electrocardiographic monitoring and risk of cardiovascular outcomes after non-ST-segment elevation acute coronary syndrome (from the MERLIN-TIMI 36 Trial). Am J Cardiol. 2011;108(10):1373–81. DOI: 10.1016/j.amjcard.2011.06.058.
- Saaby L, Poulsen TS, Hosbond S, et al. Classification of Myocardial Infarction: Frequency and Features of Type 2 Myocardial Infarction. The American Journal of Medicine. 2013;126(9):789–97. DOI: 10.1016/j.amjmed.2013.02.029.
- Gettes LS. Electrolyte abnormalities underlying lethal and ventricular arrhythmias. Circulation. 1992;85(1 Suppl):I70–6.
- Gopinathannair R, Olshansky B, Chung MK, et al. Cardiac Arrhythmias and Autonomic Dysfunction Associated With COVID-19: A Scientific Statement From the American Heart Association. Circulation. 2024;150(21):e449–e465. DOI: 10.1161/CIR.0000000000001290.
- Chapman AR, Taggart C, Boeddinghaus J, et al. Type 2 myocardial infarction: challenges in diagnosis and treatment. Eur Heart J. 2024;46(6):504–17. DOI: 10.1093/eurheartj/ehae803.
- Bhar-Amato J, Davies W, Agarwal S. Ventricular Arrhythmia after Acute Myocardial Infarction: ‘The Perfect Storm’. Arrhythm Electrophysiol Rev. 2017;6(3):134–9. DOI: 10.15420/aer.2017.24.1.
- Singh A, Gupta A, DeFilippis EM, et al. Cardiovascular Mortality After Type 1 and Type 2 Myocardial Infarction in Young Adults. J Am Coll Cardiol. 2020;75(9):1003–13. DOI: 10.1016/j.jacc.2019.12.052.
- Rymer JA, Wegermann ZK, Wang TY, et al. Ventricular Arrhythmias After Primary Percutaneous Coronary Intervention for STEMI. JAMA Netw Open. 2024;7(5):e2410288. DOI: 10.1001/jamanetworkopen.2024.10288.
- Mehta RH, Harjai KJ, Grines L, et al. Sustained ventricular tachycardia or fibrillation in the cardiac catheterization laboratory among patients receiving primary percutaneous coronary intervention: incidence, predictors, and outcomes. J Am Coll Cardiol. 2004;43(10):1765–72. DOI: 10.1016/j.jacc.2003.09.072.
- Saaby L, Poulsen TS, Hosbond S, et al. Mortality in type 1 vs. type 2 myocardial infarction. Eur Heart J. 2013;34(suppl_1). DOI: 10.1093/eurheartj/eht308.P1331.
- Raphael CE, Roger VL, Sandoval Y, et al. Incidence, Trends, and Outcomes of Type 2 Myocardial Infarction in a Community Cohort. Circulation. 2020;141(6):454–63. DOI: 10.1161/CIRCULATIONAHA.119.043100.
- Prasad PA, Isaksen JL, Abe-Jones Y, et al. Ventricular tachycardia and in-hospital mortality in the intensive care unit. Heart Rhythm O2 2023;4(11):715–22. DOI: 10.1016/j.hroo.2023.09.008.
- Lee SH, Jeong MH, Kim JH, et al. A new risk score for ventricular tachyarrhythmia in acute myocardial infarction with preserved left ventricular ejection fraction. Journal of Cardiology. 2018;72(5):420–6. DOI: 10.1016/j.jjcc.2018.04.008.
- Newby KH, Thompson T, Stebbins A, et al. Sustained Ventricular Arrhythmias in Patients Receiving Thrombolytic Therapy. Circulation. 1998;98(23):2567–73. DOI: 10.1161/01.CIR.98.23.2567.
- Demidova MM, Smith JG, Höijer CJ, et al. Prognostic impact of early ventricular fibrillation in patients with ST-elevation myocardial infarction treated with primary PCI. Eur Heart J Acute Cardiovasc Care. 2012;1(4):302–11. DOI: 10.1177/2048872612463553.
- Bougouin W, Marijon E, Puymirat E, et al. Incidence of sudden cardiac death after ventricular fibrillation complicating acute myocardial infarction: a 5-year cause-of-death analysis of the FAST-MI 2005 registry. Eur Heart J. 2014;35(2):116–22. DOI: 10.1093/eurheartj/eht453.
Article citation: Puchongmart C, Lorlowhakarn K, Thiravetyan B, Yanpiset P, Yinadsawaphan T, Kulthamrongsri N, Abdelnabi M, Leelaviwat N, Lahoti A. Ventricular arrhythmias in type 2 myocardial infarction: Incidence and in-hospital outcomes: A national inpatient analysis (2017–2022). The Southwest Journal of Medicine. 2026;14(59):8–15
From: Department of Internal Medicine, Texas Tech University Health Sciences Center, Lubbock, Tx (CP, BT, PY, NL, AL) Boston Medical Center Health System Boston, MA (KL) Department of Internal Medicine, John A Burns School of Medicine, Honolulu, HI (TY, NK) Department of Cardiovascular Medicine, Mayo Clinic, Phoenix, AZ (MA)
Conflicts of interest: none
This work is licensed under a Creative Commons Attribution-ShareAlike 4.0 International License.